
Want Credibility? Use a Chart!
If I told you there was a new medicine effective in treating a previously untreatable illness, you might be interested. If you have the illness, you might even read up and try to figure out whether the medicine would work for you. Ideally, you will evaluate the strength of evidence – was it a randomized trial; how many patients took the medicine; what is the credibility of the research team?
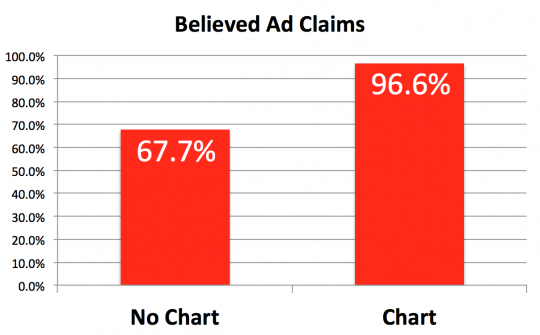
But if somewhere in the midst of that evidence there is a nice graphic, demonstrating how effective the medication is, you will be more likely to believe that the medicine works. That was what a team of researchers led by Brian Wansink found. Here is a graphic – and now I know you will believe that the study was excellent – showing the percent of people who believed the advertising claims with and without an accompanying chart:
 We have all heard about “lying with statistics.” Now we know how to persuade with pictures of statistics!